Nasdaq/US 100 Analysis
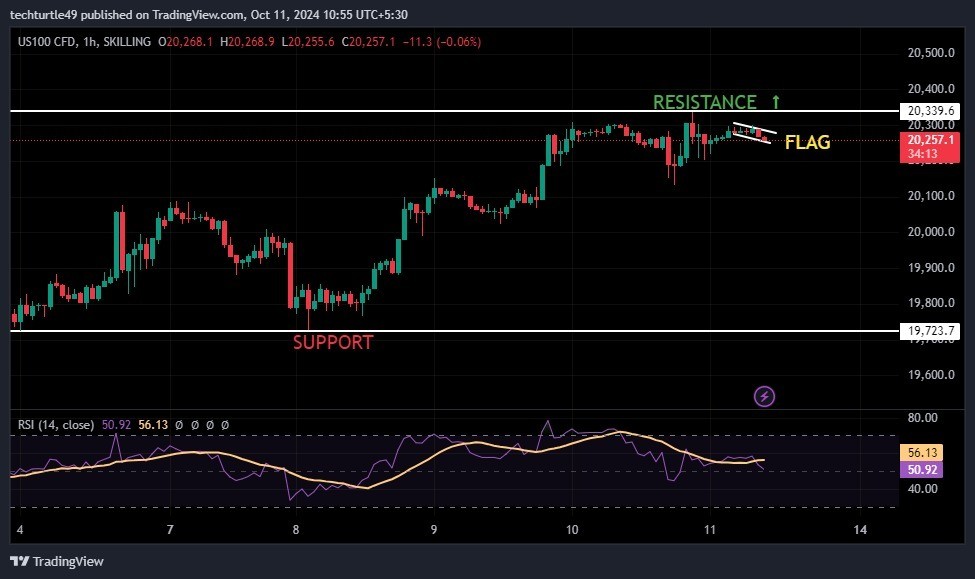
Technical Structure NASDAQ SPOT: Making bullish pattern in 4 hr time frame.
Trend: BULLISH INTRADAY
Action: BUY ON RESISTANCE BREAKOUT
R3: 20420
R2: 20360
R1: 20310
Pivot D : 20257
S1: 20200
S2: 20150
S3: 20090
Recent News
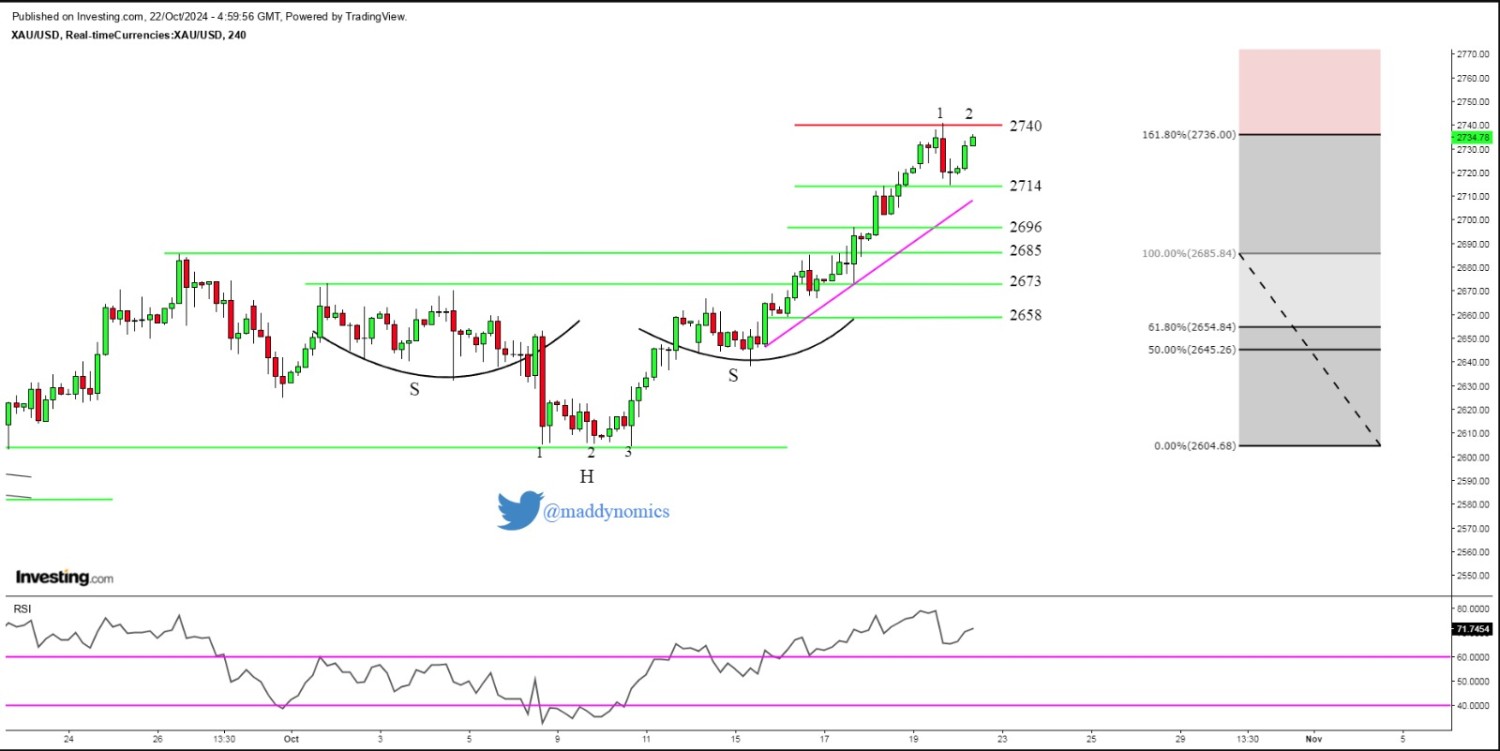
Gold may halt rally after 8 Days of Buyi...
October 22, 2024
Market Insights
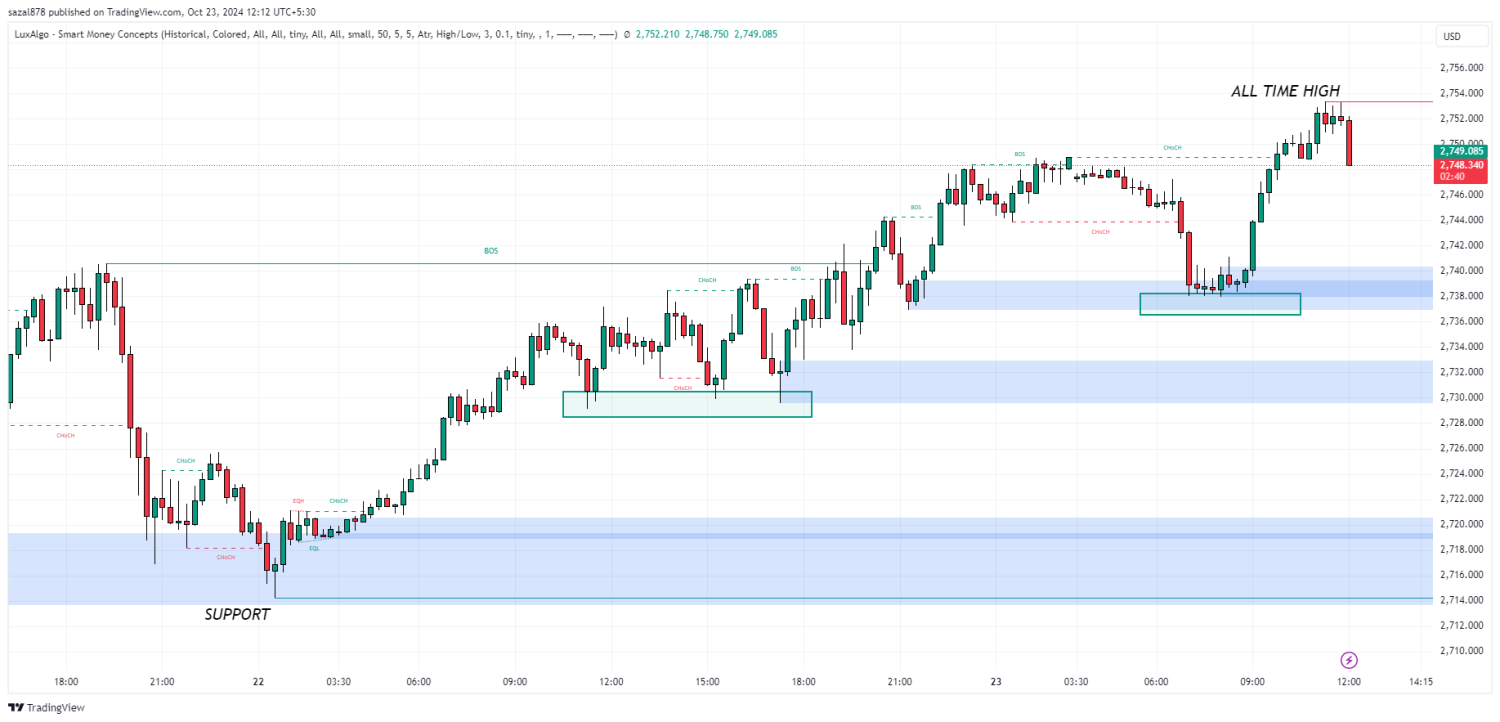
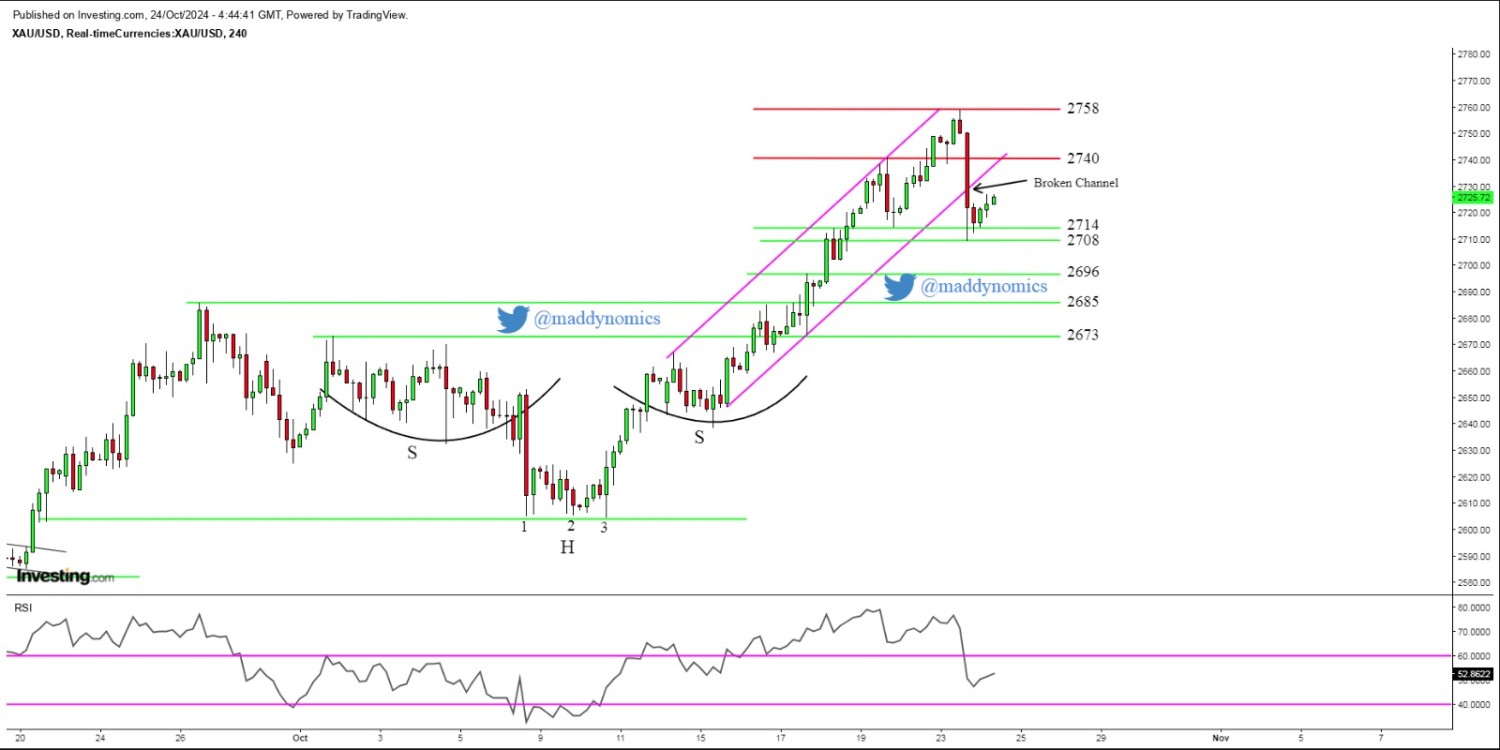
GOLD RALLY 2750!!! WHAT IS NEXT?
October 23, 2024
Market Insights
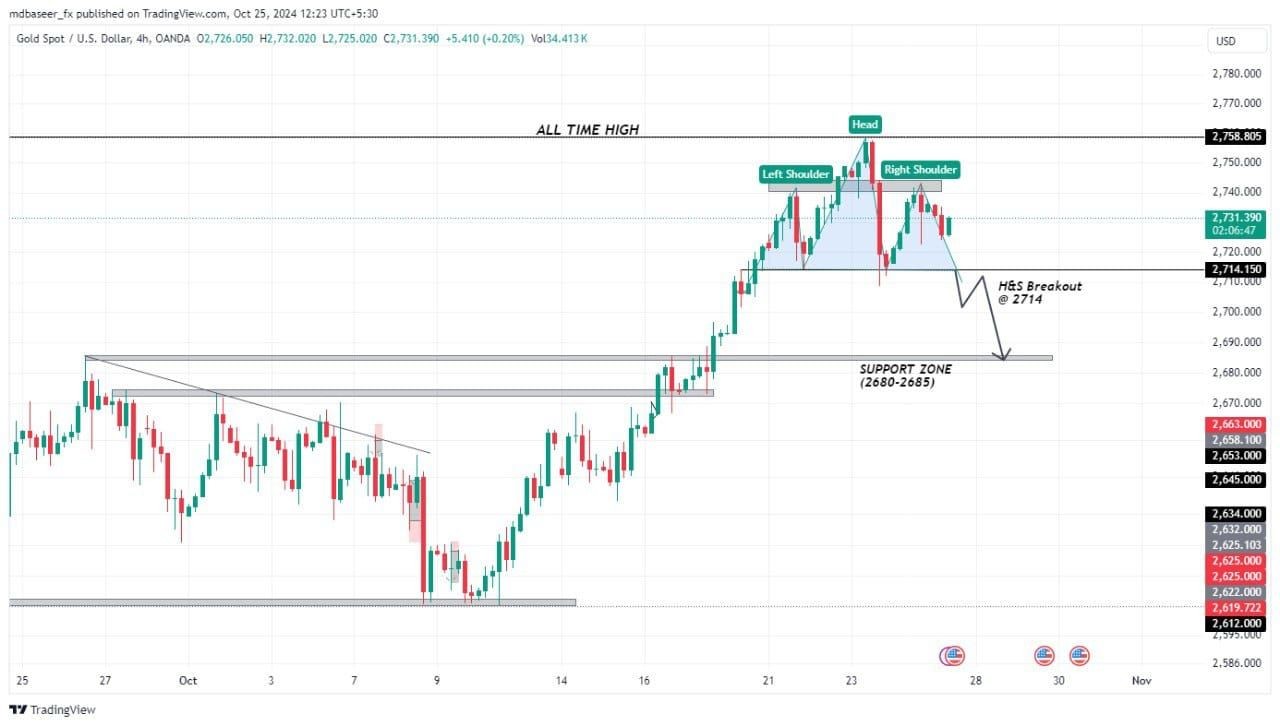
Gold may head South as Head & Shoulder a...
October 25, 2024
Market Insights
Gold attracts buyers in early European S...
October 24, 2024
Market Insights
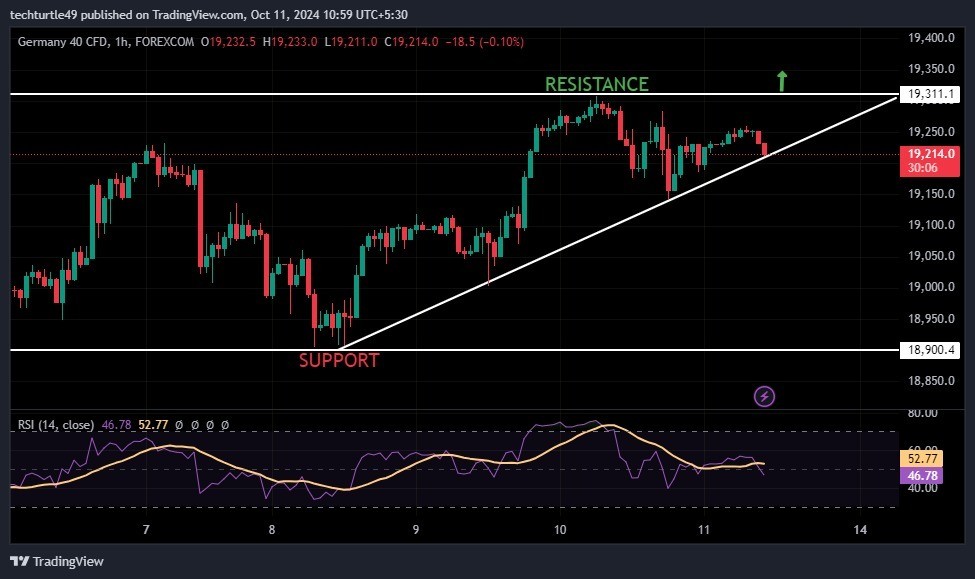
GER40/DAX Analysis
October 11, 2024
Market Insights
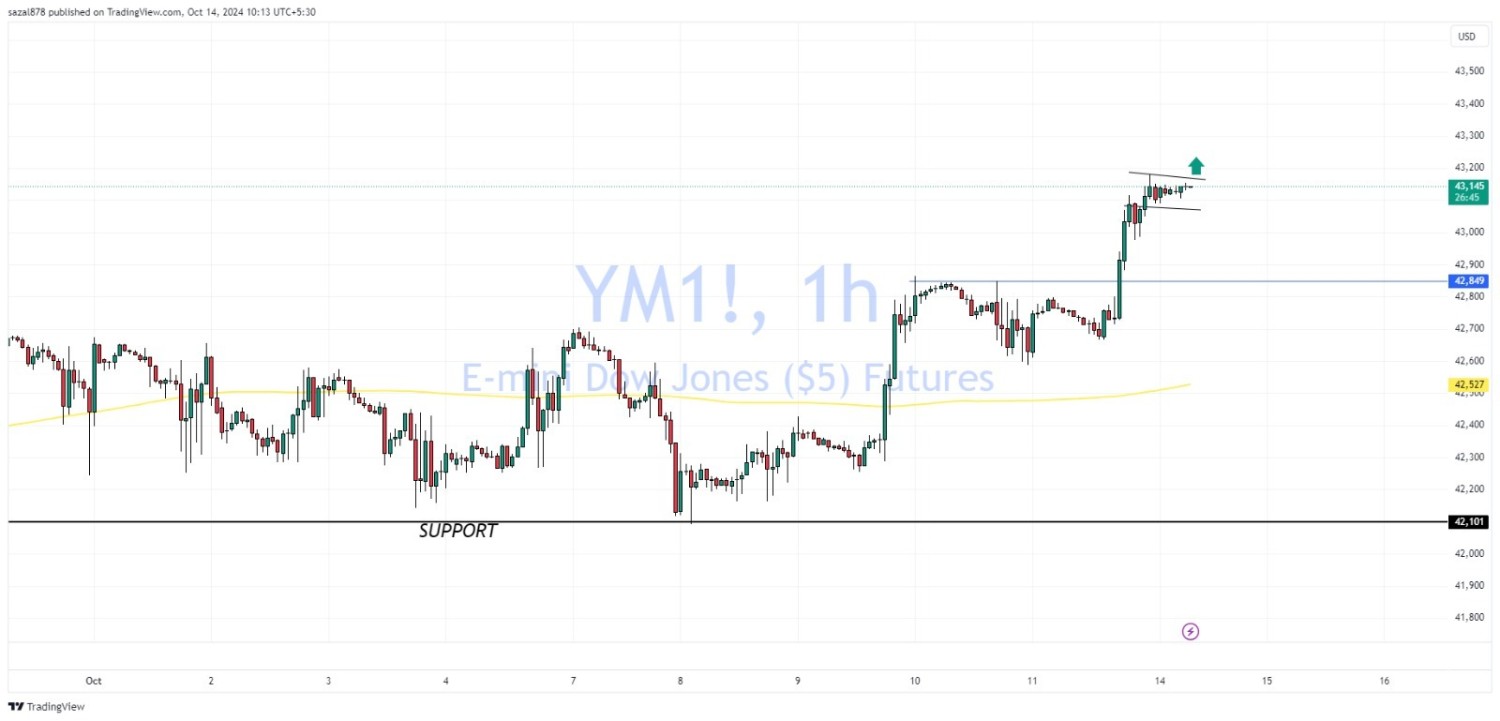
Dow Jones Analysis
October 14, 2024
Market Insights