Gold prices trading on firm note amid Middle East Tensions & US Presidential Elections Uncertainty.
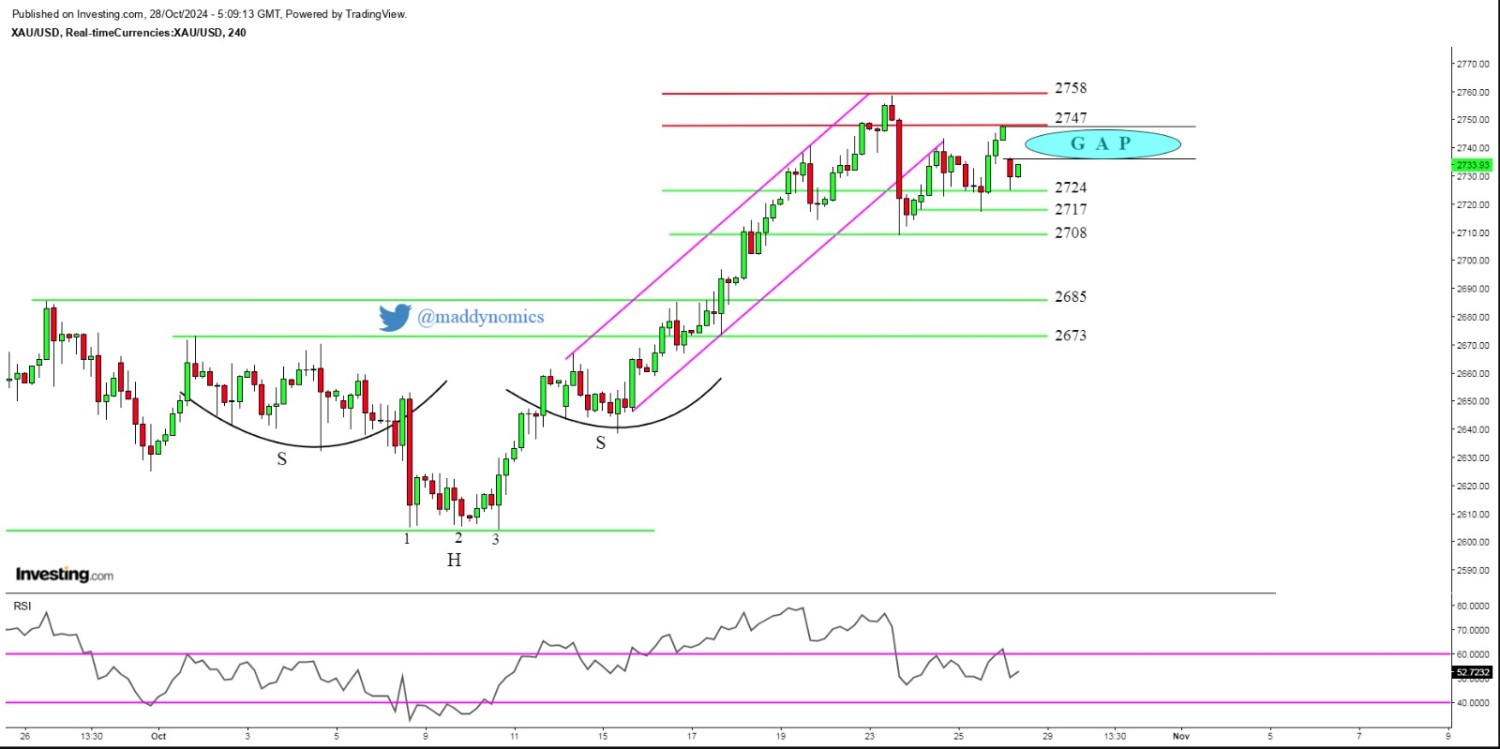
Gold opened Gap-Down on Monday morning after giving a strong close at 2747$ on Friday. However, Buyers jumped to buy yellow metal in Early Asian Session & the metal is currently trading at 2743$ after making a low at 2724$ at the time of writing this report. The weekly chart of Gold suggest that Buyers are still in control as strong bullish candle has been formed. The Dollar Index & US10 Year Bond Yields continue to rise & are at trading at 31st July,2024 highs.
Gold Structure: Strong Bullish Candle on Weekly, Hanging Man on Daily, Gap Down Opening, Distribution at Top
Intraday Strategy/ Intraday Trend: Buy on Support,Sell on Resistance/ Neutral
Weekly Trend: Hyper Bullish
Major Resistance: 2740,2747,2755
Major Support: 2725,2718,2712
Recent News
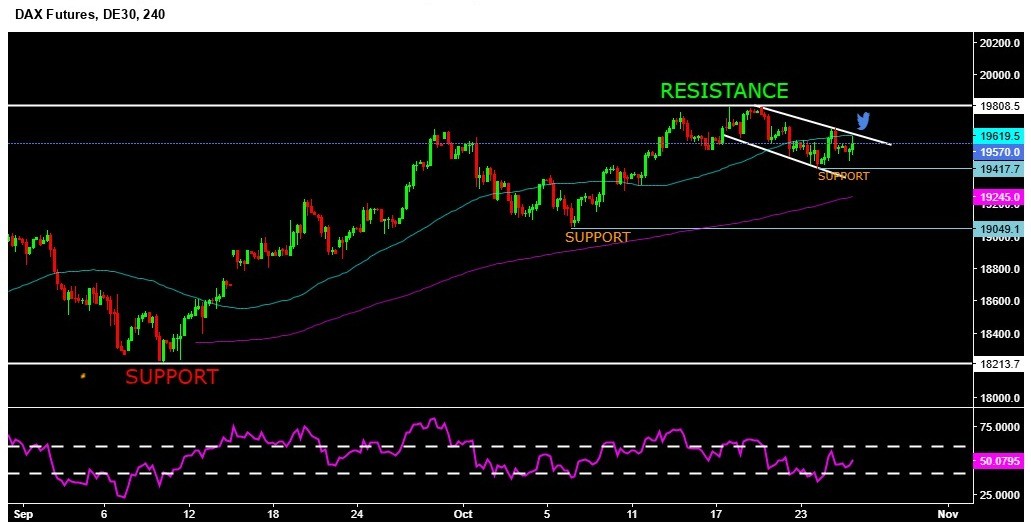
DAX sharp recovery from the daily suppor...
October 25, 2024
Market Insights

Gold Weekly Trading Strategy
October 21, 2024
Market Insights
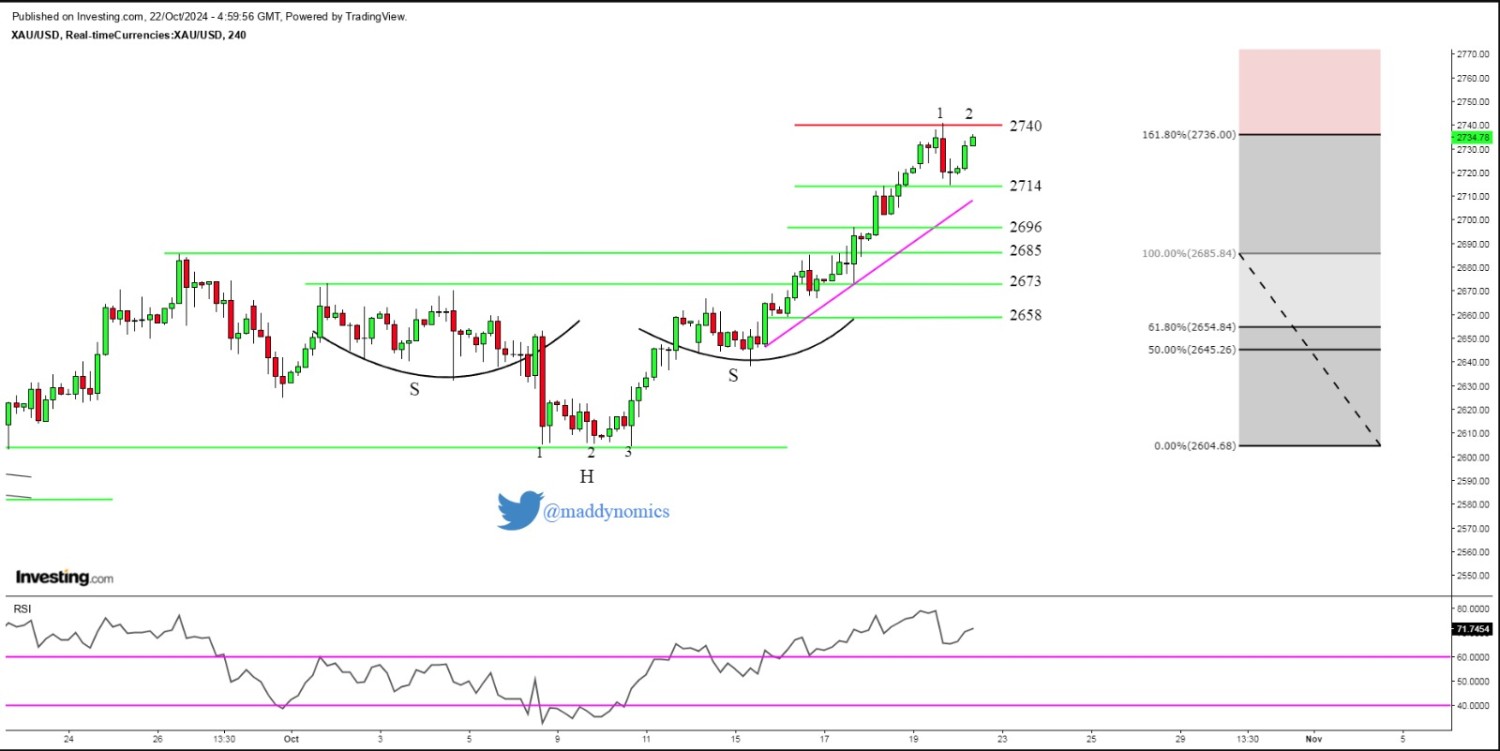
Gold may halt rally after 8 Days of Buyi...
October 22, 2024
Market Insights
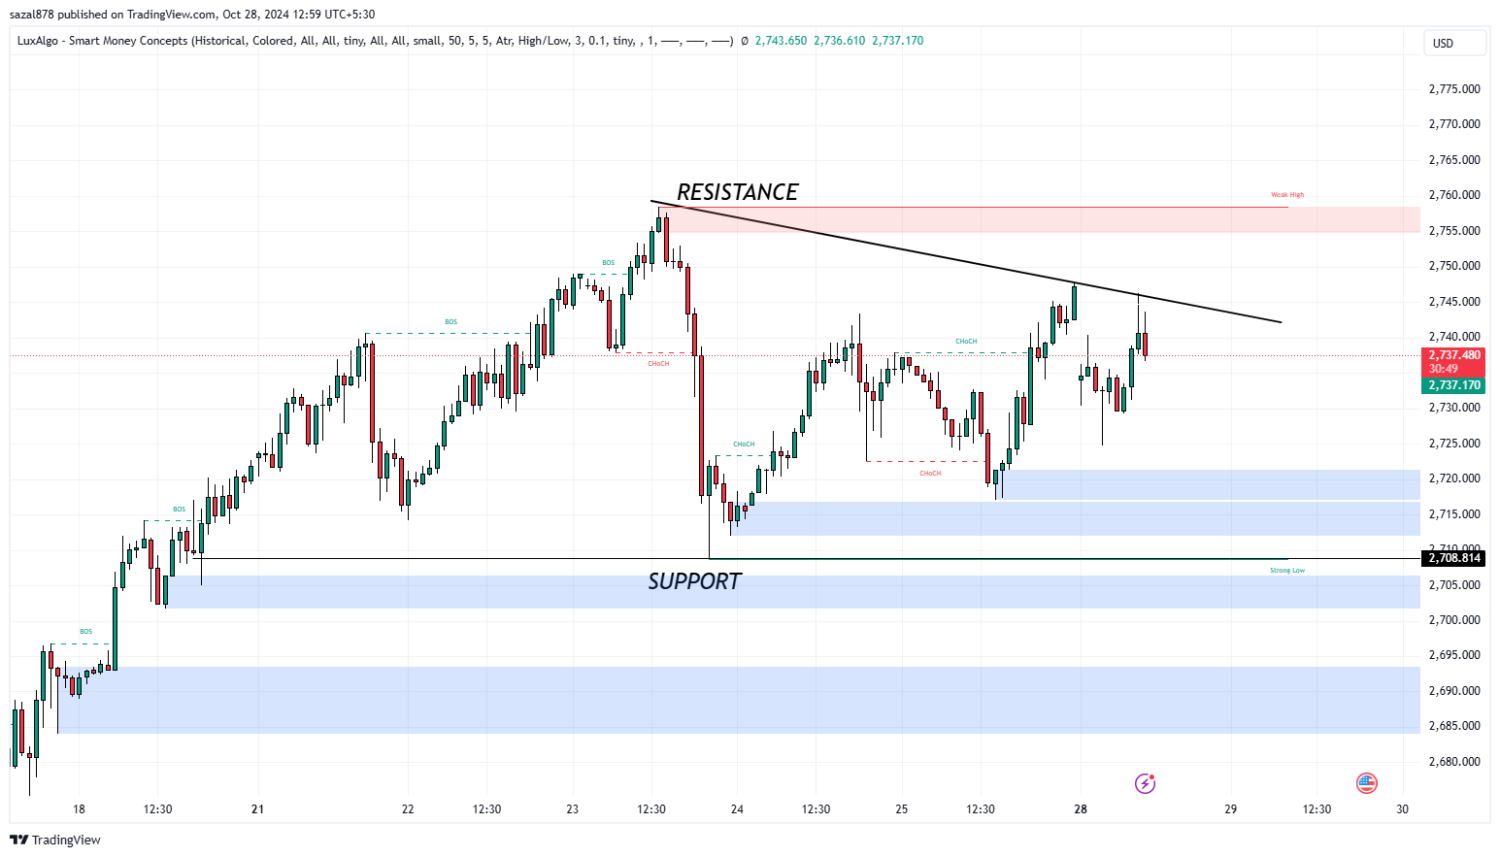
Gold Eases Amid Calmer Geopolitical Tens...
October 28, 2024
Market Insights
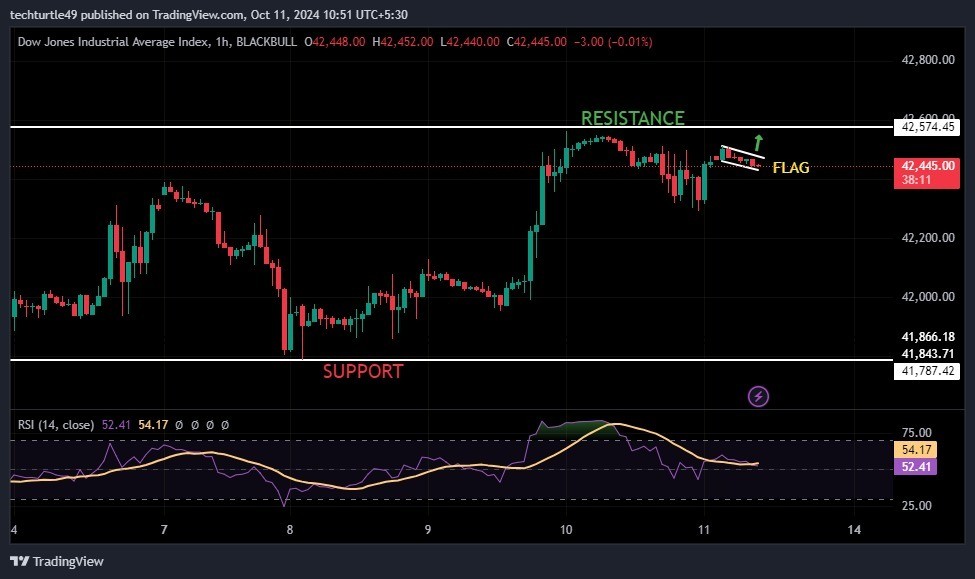
Dow Jones Day's Analysis
October 11, 2024
Market Insights

Gold Outlook.
October 11, 2024
Market Insights